The icingastats utility allows you to graph various Icinga performance statistics over time using PNP4Nagios. This is important because it can help you to:
Ensure Icinga is operating efficiently
Locate problem areas in the monitoring process
Observe the performance impacts of changes in your Icinga configuration
PNP4Nagios is one of the most popular addons due to easy installation and little maintenance during operation. The documentation along with further links to download the software can be found at http://docs.pnp4nagios.org/pnp-0.6/start.
check_nagiostats was published by Jochen Bern and can be called as an active service check or via crontab to submit passive check results. Despite its name it can be used for Icinga as well.
After downloading the plugin and placing it into the plugin directory (e.g. /usr/local/icinga/libexec if
you used the quickstart installation guides) you have to check the values of the configuration section within the script.
Most important is "EXEC=/path/to/icingastats"
(e.g. /usr/local/icinga/bin/icingastats) pointing to the icingastats binary.
Depending on your likings you may want to change the value of CUMULATE from "AVG" to "MIN" or "MAX",
respectively. The setting of TIMEFRAME influences the timeperiod which will be used for cumulated values in
the output of the plugin.
Changing the values of PASSIVE_EMERGENCY_HOST and PASSIVE_EMERGENCY_SERVICE
shouldn't be necessary because you pass the values as arguments to the script.
You can call the plugin using active or passive checks
Active
Make sure that your object configuration files contain a matching service definition such as
 define service{
    host_name               <the Icinga server>
    service_description     icingastats # (or something appropriate)
    check_command           check_stats
    check_interval          1
    retry_interval          1
    ...
 }
and a command definition
 define command{
    command_name            check_stats
    command_line            $USER1$/check_nagiostats
 }
Don't forget to restart Icinga after these changes.
Passive
Make sure that your object configuration files contain a matching service definition such as
 define service{
    host_name               <the Icinga server>
    service_description     icingastats # (or something appropriate)
    active_checks_enabled   0
    check_command           check_stats!3!Freshness threshold exceeded
    check_freshness         1
    freshness_threshold     180         # check interval + x seconds
    ...
 }
and a command definition
 define command{
    command_name            check_stats
    command_line            $USER1$/check_dummy $ARG1$ $ARG2$
 }
Don't forget to restart Icinga after this change.
Add a line to the crontab of the Icinga user which will call the icingastats binary and submit
the results to the command pipe
* * * * * /usr/local/icinga/libexec/check_nagiostats --passive <host> icingastats >> /usr/local/icinga/var/rw/icinga.cmd
This way the values are updated in regular intervals.
Create a symbolic link in the (user) templates folder of PNP4Nagios
$> ln -s ../templates.dist/nagiostats.php check_stats.php
Make sure that check_stats (without the extension .php) matches the value you specified as first parameter in the check_command.
Example Graphs
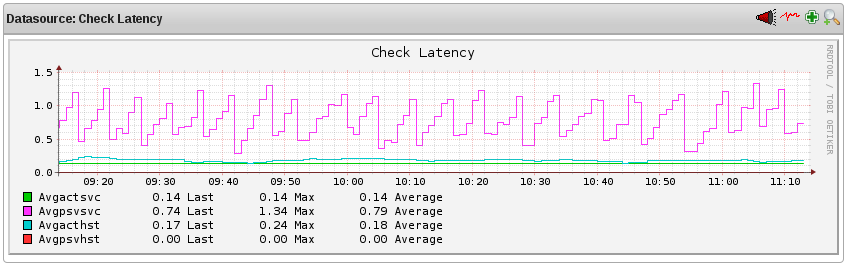
We'll describe what the graphs produced by check_nagiostats mean and what they can be used for...
This graph shows the average latency times of hosts and services over time for both active and passive checks, respectively. Useful for understanding:
Consistently high latencies can be an indication that one or more of the following variables need tweaking:
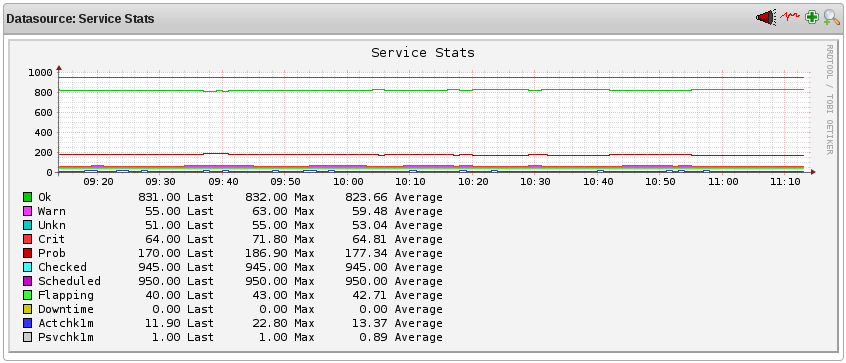
This graph shows the values for the several service states along with the average number of services being checked actively/passively within the timeperiod you specified. Useful for understanding:
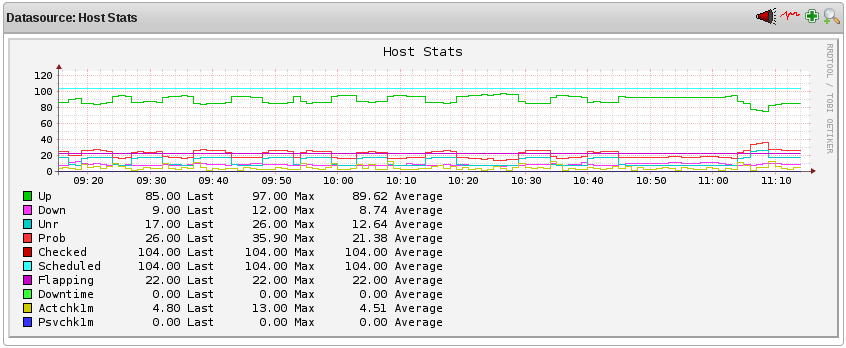
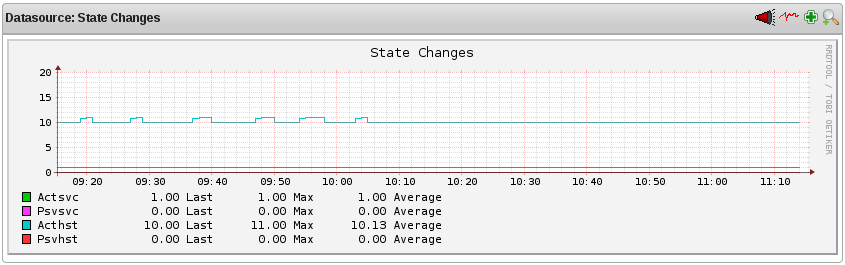
This graph shows the values for the several host states along with the average number of hosts being checked actively/passively within the timeperiod you specified. Useful for understanding:
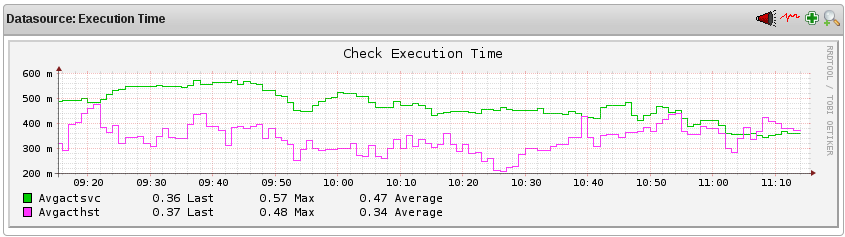
This graph shows the average execution times of hosts and services over time. Useful for understanding:
![[Note]](../images/note.png) |
Note |
|---|---|
|
To be honest: We tweaked the graphs a bit, meaning the colours. Yellow is sometimes hard to distinguish from the background so
we changed some lines in the PNP4Nagios template file |
Additional graphs
Well, we tweaked the template a bit more because the plugin delivers the data but there aren't appropriate graphs (but looking at the template file it is very easy to add the lines if you really need the following graphs).
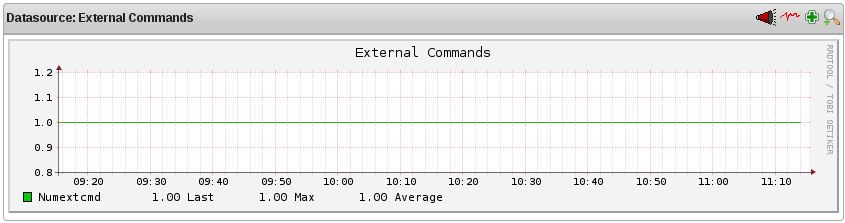
This graph shows how may external commands have been processed by the Icinga daemon over time. Unless you're processing a large number of external commands (as in the case with distributed monitoring setups), this graph may appear mostly empty. Monitoring external commands can be useful for understanding the impacts of:
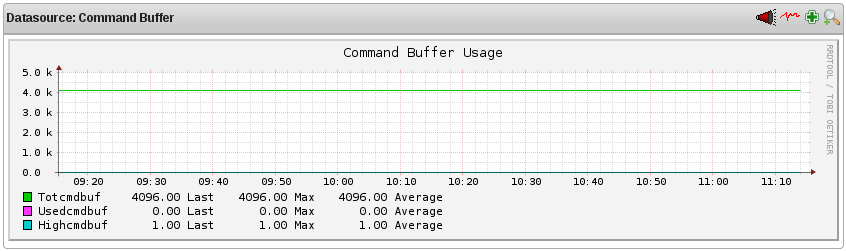
This graph shows how many external command buffer slots are in use over time. If the number of used buffers is near the number of available buffers on a regular basis, it is likely you need to increase the available external command buffer slots. Each buffer slot can hold one external command. Buffers are used for temporarily holding external commands from the time they are read from the external command file to the time they are processed by the Icinga daemon.
As you can see just one buffer is used and that's the one for the graphs as mentioned above.
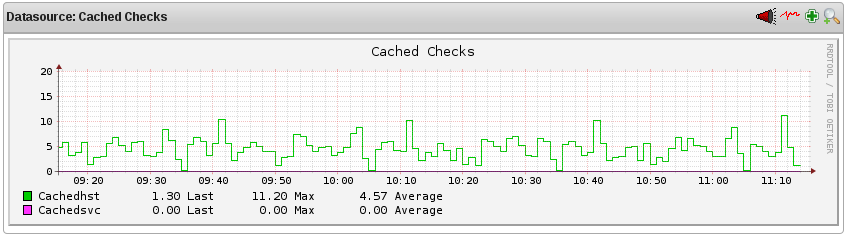
This graph shows how may cached host and service checks have occurred over time. Useful for understanding:
© 1999-2009 Ethan Galstad, 2009-2017 Icinga Development Team, https://www.icinga.com