guiqwt
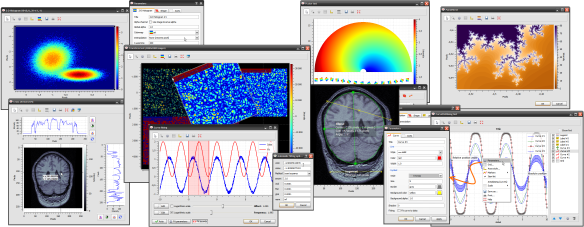
Based on PythonQwt (plotting widgets for Qt graphical user interfaces) and on the scientific modules NumPy and SciPy, guiqwt is a Python library providing efficient 2D data-plotting features (curve/image visualization and related tools) for interactive computing and signal/image processing application development.
- External resources:
Python Package Index: PyPI
Bug reports and feature requests: GitHub
Help, support and discussions around the project: GoogleGroup
Note
Windows users may download the CHM Manual.
After downloading this file, you may see blank pages in the documentation. That’s because Windows is blocking CHM files for security reasons. Fixing this problem is easy:
Right-click the CHM file, select properties, then click “Unblock”.
Or compress the CHM file into a zip archive and decompress it in another directory.
Do not open the CHM file on a network drive.
Contents:
Indices and tables: