Ctrl+K
You are reading documentation for the unreleased version of Matplotlib. Try searching for the released version of this page instead?
Matplotlib 3.10.1+dfsg1 documentation - Home Matplotlib 3.10.1+dfsg1 documentation - Home
  • Plot types
  • User guide
  • Tutorials
  • Examples
  • Reference
  • Contribute
  • Releases
  • Gitter
  • Discourse
  • GitHub
  • Twitter
  • Plot types
  • User guide
  • Tutorials
  • Examples
  • Reference
  • Contribute
  • Releases
  • Gitter
  • Discourse
  • GitHub
  • Twitter

Section Navigation

  • Lines, bars and markers
    • Infinite lines
    • Bar chart with individual bar colors
    • Bar chart with labels
    • Stacked bar chart
    • Grouped bar chart with labels
    • Horizontal bar chart
    • Broken horizontal bars
    • CapStyle
    • Plotting categorical variables
    • Plotting the coherence of two signals
    • Cross spectral density (CSD)
    • Curve with error band
    • Errorbar limit selection
    • Errorbar subsampling
    • EventCollection Demo
    • Eventplot demo
    • Filled polygon
    • fill_between with transparency
    • Fill the area between two lines
    • Fill the area between two vertical lines
    • Bar chart with gradients
    • Hat graph
    • Discrete distribution as horizontal bar chart
    • JoinStyle
    • Dashed line style configuration
    • Lines with a ticked patheffect
    • Linestyles
    • Marker reference
    • Markevery Demo
    • Plotting masked and NaN values
    • Multicolored lines
    • Mapping marker properties to multivariate data
    • Power spectral density (PSD)
    • Scatter Demo2
    • Scatter plot with histograms
    • Scatter plot with masked values
    • Marker examples
    • Scatter plot with a legend
    • Line plot
    • Shade regions defined by a logical mask using fill_between
    • Spectrum representations
    • Stackplots and streamgraphs
    • Stairs Demo
    • Stem plot
    • Step Demo
    • Timeline with lines, dates, and text
    • hlines and vlines
    • Cross- and auto-correlation
  • Images, contours and fields
  • Subplots, axes and figures
  • Statistics
  • Pie and polar charts
  • Text, labels and annotations
  • Color
  • Shapes and collections
  • Style sheets
  • Module - pyplot
  • Module - axes_grid1
  • Module - axisartist
  • Showcase
  • Animation
  • Event handling
  • Miscellaneous
  • 3D plotting
  • Scales
  • Specialty plots
  • Spines
  • Ticks
  • Units
  • Embedding Matplotlib in graphical user interfaces
  • Widgets
  • Userdemo
  • Examples
  • Lines, bars and markers
  • CapStyle

Note

Go to the end to download the full example code.
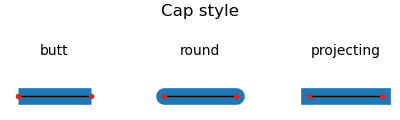
CapStyle#

The matplotlib._enums.CapStyle controls how Matplotlib draws the two endpoints (caps) of an unclosed line. For more details, see the CapStyle docs.

import matplotlib.pyplot as plt

from matplotlib._enums import CapStyle

CapStyle.demo()
plt.show()
Cap style

Download Jupyter notebook: capstyle.ipynb

Download Python source code: capstyle.py

Download zipped: capstyle.zip

Gallery generated by Sphinx-Gallery

© Copyright 2002–2012 John Hunter, Darren Dale, Eric Firing, Michael Droettboom and the Matplotlib development team; 2012–2025 The Matplotlib development team.

Created using Sphinx 8.1.3.

Built from 3.10.1+dfsg1.

Built with the PyData Sphinx Theme 0.16.1.