Note
Go to the end to download the full example code.
Curve with error band#
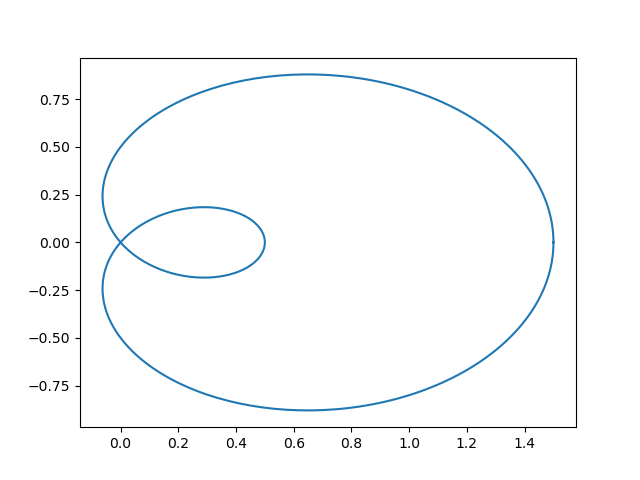
This example illustrates how to draw an error band around a parametrized curve.
A parametrized curve x(t), y(t) can directly be drawn using plot.
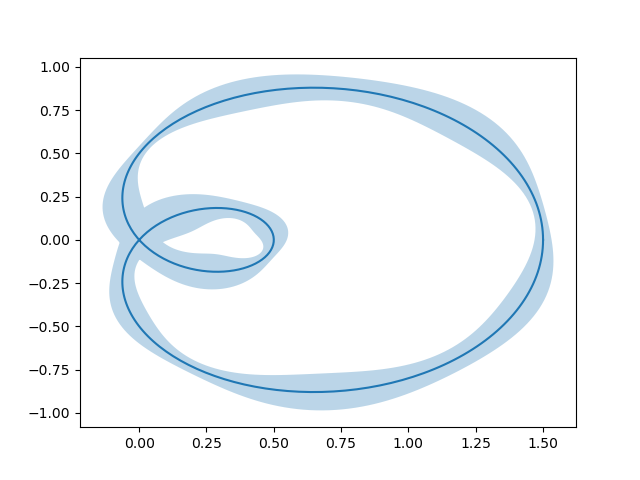
An error band can be used to indicate the uncertainty of the curve. In this example we assume that the error can be given as a scalar err that describes the uncertainty perpendicular to the curve in every point.
We visualize this error as a colored band around the path using a
PathPatch. The patch is created from two path segments (xp, yp), and
(xn, yn) that are shifted by +/- err perpendicular to the curve (x, y).
Note: This method of using a PathPatch is suited to arbitrary curves in
2D. If you just have a standard y-vs.-x plot, you can use the simpler
fill_between method (see also
Fill the area between two lines).
def draw_error_band(ax, x, y, err, **kwargs):
    # Calculate normals via centered finite differences (except the first point
    # which uses a forward difference and the last point which uses a backward
    # difference).
    dx = np.concatenate([[x[1] - x[0]], x[2:] - x[:-2], [x[-1] - x[-2]]])
    dy = np.concatenate([[y[1] - y[0]], y[2:] - y[:-2], [y[-1] - y[-2]]])
    l = np.hypot(dx, dy)
    nx = dy / l
    ny = -dx / l

    # end points of errors
    xp = x + nx * err
    yp = y + ny * err
    xn = x - nx * err
    yn = y - ny * err

    vertices = np.block([[xp, xn[::-1]],
                         [yp, yn[::-1]]]).T
    codes = np.full(len(vertices), Path.LINETO)
    codes[0] = codes[len(xp)] = Path.MOVETO
    path = Path(vertices, codes)
    ax.add_patch(PathPatch(path, **kwargs))


_, axs = plt.subplots(1, 2, layout='constrained', sharex=True, sharey=True)
errs = [
    (axs[0], "constant error", 0.05),
    (axs[1], "variable error", 0.05 * np.sin(2 * t) ** 2 + 0.04),
]
for i, (ax, title, err) in enumerate(errs):
    ax.set(title=title, aspect=1, xticks=[], yticks=[])
    ax.plot(x, y, "k")
    draw_error_band(ax, x, y, err=err,
                    facecolor=f"C{i}", edgecolor="none", alpha=.3)

plt.show()
References
The use of the following functions, methods, classes and modules is shown in this example: