Ctrl+K
You are reading documentation for the unreleased version of Matplotlib. Try searching for the released version of this page instead?
Matplotlib 3.10.1+dfsg1 documentation - Home Matplotlib 3.10.1+dfsg1 documentation - Home
  • Plot types
  • User guide
  • Tutorials
  • Examples
  • Reference
  • Contribute
  • Releases
  • Gitter
  • Discourse
  • GitHub
  • Twitter
  • Plot types
  • User guide
  • Tutorials
  • Examples
  • Reference
  • Contribute
  • Releases
  • Gitter
  • Discourse
  • GitHub
  • Twitter

Section Navigation

  • Lines, bars and markers
  • Images, contours and fields
  • Subplots, axes and figures
  • Statistics
  • Pie and polar charts
    • Pie charts
    • Bar of pie
    • Nested pie charts
    • A pie and a donut with labels
    • Bar chart on polar axis
    • Polar plot
    • Error bar rendering on polar axis
    • Polar legend
    • Scatter plot on polar axis
  • Text, labels and annotations
  • Color
  • Shapes and collections
  • Style sheets
  • Module - pyplot
  • Module - axes_grid1
  • Module - axisartist
  • Showcase
  • Animation
  • Event handling
  • Miscellaneous
  • 3D plotting
  • Scales
  • Specialty plots
  • Spines
  • Ticks
  • Units
  • Embedding Matplotlib in graphical user interfaces
  • Widgets
  • Userdemo
  • Examples
  • Pie and polar charts

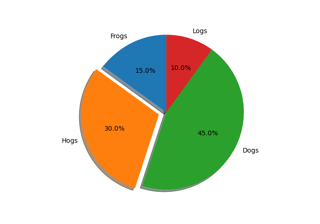
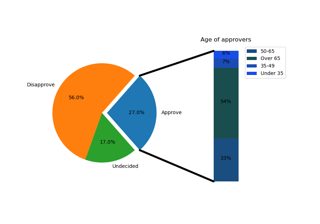
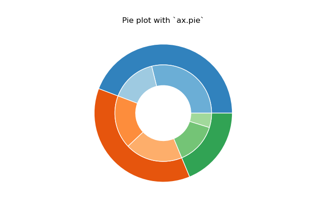
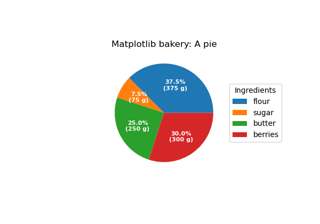
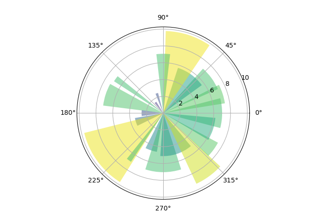
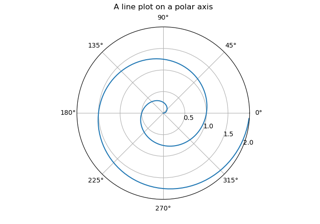
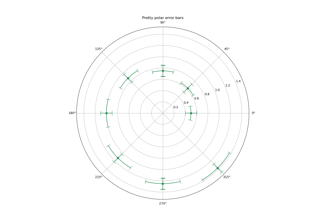
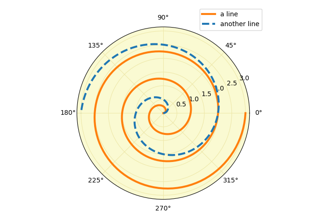
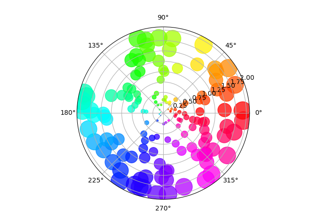
Pie and polar charts#

Pie charts

Pie charts

Bar of pie

Bar of pie

Nested pie charts

Nested pie charts

A pie and a donut with labels

A pie and a donut with labels

Bar chart on polar axis

Bar chart on polar axis

Polar plot

Polar plot

Error bar rendering on polar axis

Error bar rendering on polar axis

Polar legend

Polar legend

Scatter plot on polar axis

Scatter plot on polar axis

© Copyright 2002–2012 John Hunter, Darren Dale, Eric Firing, Michael Droettboom and the Matplotlib development team; 2012–2025 The Matplotlib development team.

Created using Sphinx 8.1.3.

Built from 3.10.1+dfsg1.

Built with the PyData Sphinx Theme 0.16.1.