Ctrl+K
You are reading documentation for the unreleased version of Matplotlib. Try searching for the released version of this page instead?
Matplotlib 3.10.1+dfsg1 documentation - Home Matplotlib 3.10.1+dfsg1 documentation - Home
  • Plot types
  • User guide
  • Tutorials
  • Examples
  • Reference
  • Contribute
  • Releases
  • Gitter
  • Discourse
  • GitHub
  • Twitter
  • Plot types
  • User guide
  • Tutorials
  • Examples
  • Reference
  • Contribute
  • Releases
  • Gitter
  • Discourse
  • GitHub
  • Twitter

Section Navigation

  • Lines, bars and markers
  • Images, contours and fields
  • Subplots, axes and figures
  • Statistics
  • Pie and polar charts
  • Text, labels and annotations
  • Color
  • Shapes and collections
  • Style sheets
  • Module - pyplot
  • Module - axes_grid1
  • Module - axisartist
  • Showcase
    • Anatomy of a figure
    • Firefox
    • Integral as the area under a curve
    • Shaded & power normalized rendering
    • Pan/zoom events of overlapping axes
    • Stock prices over 32 years
    • XKCD
  • Animation
  • Event handling
  • Miscellaneous
  • 3D plotting
  • Scales
  • Specialty plots
  • Spines
  • Ticks
  • Units
  • Embedding Matplotlib in graphical user interfaces
  • Widgets
  • Userdemo
  • Examples
  • Showcase

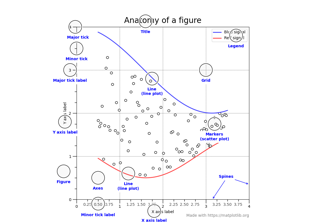
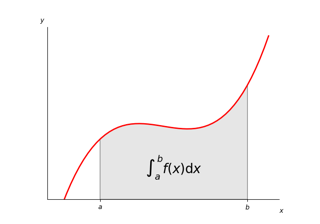
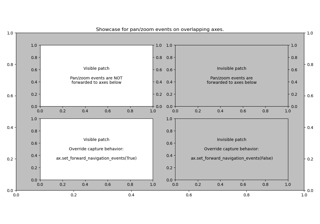
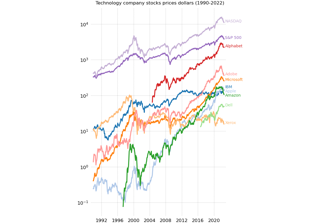
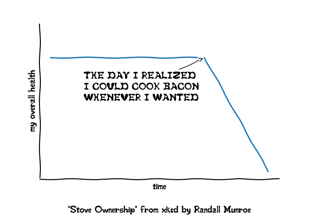
Showcase#

Anatomy of a figure

Anatomy of a figure

Firefox

Firefox

Integral as the area under a curve

Integral as the area under a curve

Shaded & power normalized rendering

Shaded & power normalized rendering

Pan/zoom events of overlapping axes

Pan/zoom events of overlapping axes

Stock prices over 32 years

Stock prices over 32 years

XKCD

XKCD

© Copyright 2002–2012 John Hunter, Darren Dale, Eric Firing, Michael Droettboom and the Matplotlib development team; 2012–2025 The Matplotlib development team.

Created using Sphinx 8.1.3.

Built from 3.10.1+dfsg1.

Built with the PyData Sphinx Theme 0.16.1.