Ctrl+K
You are reading documentation for the unreleased version of Matplotlib. Try searching for the released version of this page instead?
Matplotlib 3.10.1+dfsg1 documentation - Home Matplotlib 3.10.1+dfsg1 documentation - Home
  • Plot types
  • User guide
  • Tutorials
  • Examples
  • Reference
  • Contribute
  • Releases
  • Gitter
  • Discourse
  • GitHub
  • Twitter
  • Plot types
  • User guide
  • Tutorials
  • Examples
  • Reference
  • Contribute
  • Releases
  • Gitter
  • Discourse
  • GitHub
  • Twitter

Section Navigation

  • Lines, bars and markers
  • Images, contours and fields
  • Subplots, axes and figures
  • Statistics
  • Pie and polar charts
  • Text, labels and annotations
  • Color
  • Shapes and collections
  • Style sheets
  • Module - pyplot
  • Module - axes_grid1
  • Module - axisartist
  • Showcase
  • Animation
  • Event handling
  • Miscellaneous
  • 3D plotting
  • Scales
  • Specialty plots
  • Spines
    • Spines
    • Spine placement
    • Dropped spines
    • Multiple y-axis with Spines
    • Centered spines with arrows
  • Ticks
  • Units
  • Embedding Matplotlib in graphical user interfaces
  • Widgets
  • Userdemo
  • Examples
  • Spines

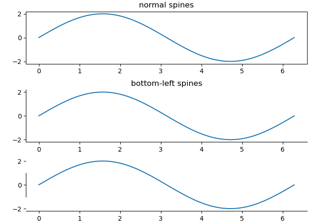
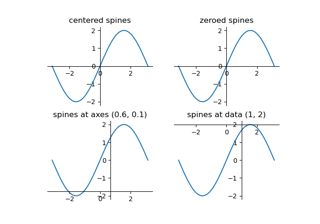
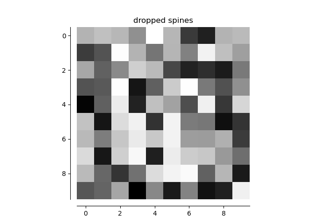
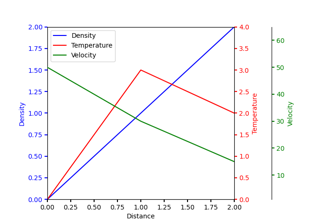
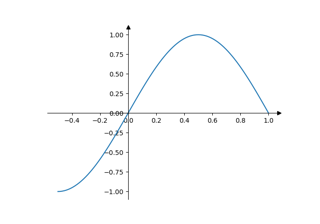
Spines#

Spines

Spines

Spine placement

Spine placement

Dropped spines

Dropped spines

Multiple y-axis with Spines

Multiple y-axis with Spines

Centered spines with arrows

Centered spines with arrows

© Copyright 2002–2012 John Hunter, Darren Dale, Eric Firing, Michael Droettboom and the Matplotlib development team; 2012–2025 The Matplotlib development team.

Created using Sphinx 8.1.3.

Built from 3.10.1+dfsg1.

Built with the PyData Sphinx Theme 0.16.1.