Ctrl+K
You are reading documentation for the unreleased version of Matplotlib. Try searching for the released version of this page instead?
Matplotlib 3.10.1+dfsg1 documentation - Home Matplotlib 3.10.1+dfsg1 documentation - Home
  • Plot types
  • User guide
  • Tutorials
  • Examples
  • Reference
  • Contribute
  • Releases
  • Gitter
  • Discourse
  • GitHub
  • Twitter
  • Plot types
  • User guide
  • Tutorials
  • Examples
  • Reference
  • Contribute
  • Releases
  • Gitter
  • Discourse
  • GitHub
  • Twitter

Section Navigation

  • Lines, bars and markers
  • Images, contours and fields
  • Subplots, axes and figures
  • Statistics
  • Pie and polar charts
  • Text, labels and annotations
  • Color
  • Shapes and collections
  • Style sheets
  • Module - pyplot
  • Module - axes_grid1
  • Module - axisartist
  • Showcase
  • Animation
  • Event handling
  • Miscellaneous
  • 3D plotting
  • Scales
  • Specialty plots
  • Spines
  • Ticks
  • Units
    • Annotation with units
    • Artist tests
    • Bar demo with units
    • Group barchart with units
    • Basic units
    • Ellipse with units
    • Evans test
    • Radian ticks
    • Inches and centimeters
    • Unit handling
  • Embedding Matplotlib in graphical user interfaces
  • Widgets
  • Userdemo
  • Examples
  • Units

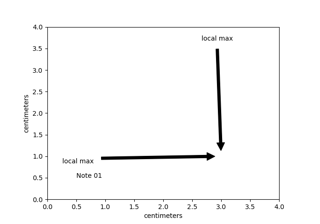
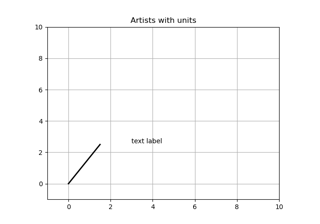
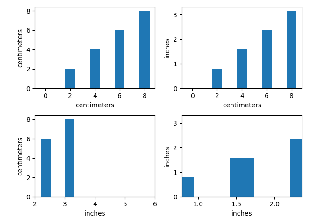
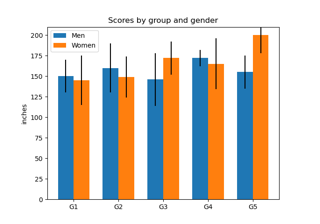
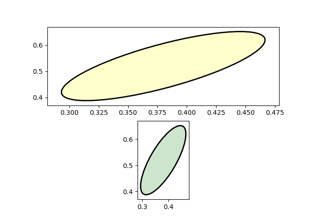
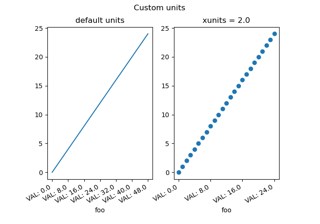
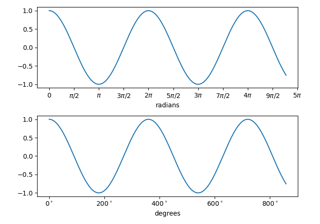
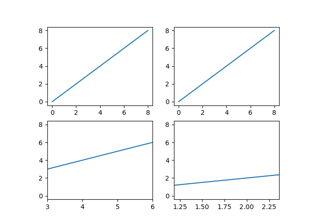
Units#

These examples cover the many representations of units in Matplotlib.

Annotation with units

Annotation with units

Artist tests

Artist tests

Bar demo with units

Bar demo with units

Group barchart with units

Group barchart with units

Basic units

Basic units

Ellipse with units

Ellipse with units

Evans test

Evans test

Radian ticks

Radian ticks

Inches and centimeters

Inches and centimeters

Unit handling

Unit handling

© Copyright 2002–2012 John Hunter, Darren Dale, Eric Firing, Michael Droettboom and the Matplotlib development team; 2012–2025 The Matplotlib development team.

Created using Sphinx 8.1.3.

Built from 3.10.1+dfsg1.

Built with the PyData Sphinx Theme 0.16.1.