Ctrl+K
You are reading documentation for the unreleased version of Matplotlib. Try searching for the released version of this page instead?
Matplotlib 3.10.1+dfsg1 documentation - Home Matplotlib 3.10.1+dfsg1 documentation - Home
  • Plot types
  • User guide
  • Tutorials
  • Examples
  • Reference
  • Contribute
  • Releases
  • Gitter
  • Discourse
  • GitHub
  • Twitter
  • Plot types
  • User guide
  • Tutorials
  • Examples
  • Reference
  • Contribute
  • Releases
  • Gitter
  • Discourse
  • GitHub
  • Twitter

Section Navigation

  • Pairwise data
  • Statistical distributions
  • Gridded data
    • imshow(Z)
    • pcolormesh(X, Y, Z)
    • contour(X, Y, Z)
    • contourf(X, Y, Z)
    • barbs(X, Y, U, V)
    • quiver(X, Y, U, V)
    • streamplot(X, Y, U, V)
  • Irregularly gridded data
  • 3D and volumetric data
  • Plot types
  • Gridded data

Gridded data#

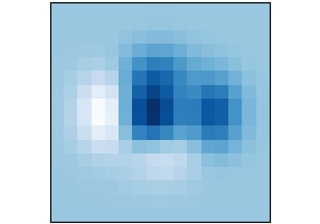
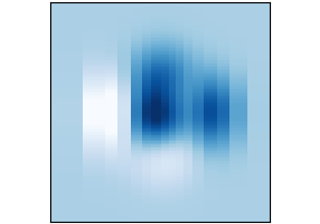
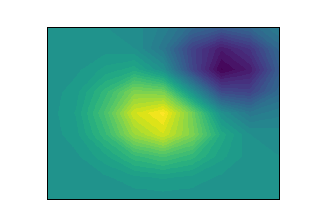
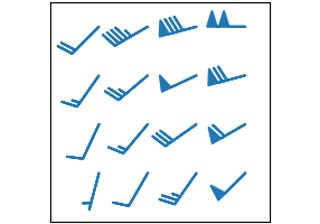
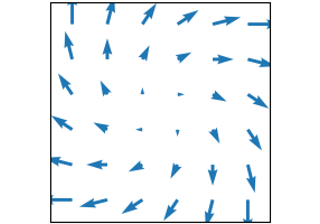
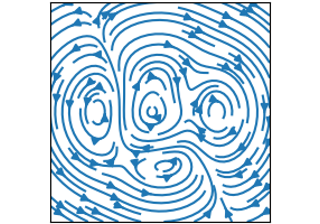
Plots of arrays and images \(Z_{i, j}\) and fields \(U_{i, j}, V_{i, j}\) on regular grids and corresponding coordinate grids \(X_{i,j}, Y_{i,j}\).

imshow(Z)

imshow(Z)

pcolormesh(X, Y, Z)

pcolormesh(X, Y, Z)

contour(X, Y, Z)

contour(X, Y, Z)

contourf(X, Y, Z)

contourf(X, Y, Z)

barbs(X, Y, U, V)

barbs(X, Y, U, V)

quiver(X, Y, U, V)

quiver(X, Y, U, V)

streamplot(X, Y, U, V)

streamplot(X, Y, U, V)

© Copyright 2002–2012 John Hunter, Darren Dale, Eric Firing, Michael Droettboom and the Matplotlib development team; 2012–2025 The Matplotlib development team.

Created using Sphinx 8.1.3.

Built from 3.10.1+dfsg1.

Built with the PyData Sphinx Theme 0.16.1.