Ctrl+K
You are reading documentation for the unreleased version of Matplotlib. Try searching for the released version of this page instead?
Matplotlib 3.10.1+dfsg1 documentation - Home Matplotlib 3.10.1+dfsg1 documentation - Home
  • Plot types
  • User guide
  • Tutorials
  • Examples
  • Reference
  • Contribute
  • Releases
  • Gitter
  • Discourse
  • GitHub
  • Twitter
  • Plot types
  • User guide
  • Tutorials
  • Examples
  • Reference
  • Contribute
  • Releases
  • Gitter
  • Discourse
  • GitHub
  • Twitter

Section Navigation

  • Pairwise data
    • plot(x, y)
    • scatter(x, y)
    • bar(x, height)
    • stem(x, y)
    • fill_between(x, y1, y2)
    • stackplot(x, y)
    • stairs(values)
  • Statistical distributions
  • Gridded data
  • Irregularly gridded data
  • 3D and volumetric data
  • Plot types
  • Pairwise data

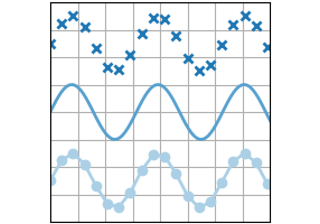
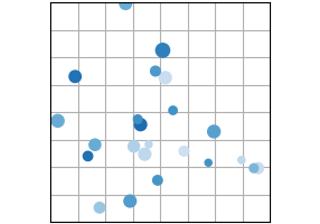
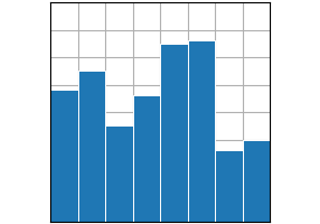
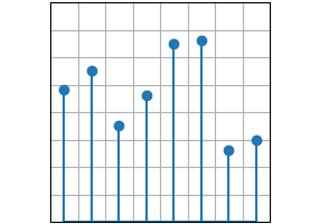
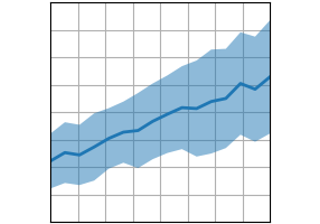
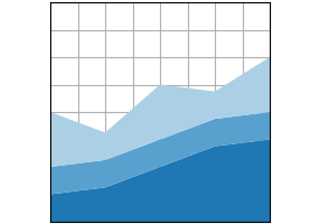
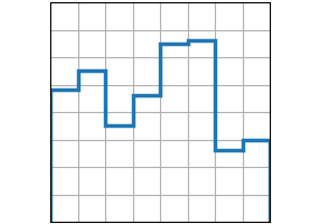
Pairwise data#

Plots of pairwise \((x, y)\), tabular \((var\_0, \cdots, var\_n)\), and functional \(f(x)=y\) data.

plot(x, y)

plot(x, y)

scatter(x, y)

scatter(x, y)

bar(x, height)

bar(x, height)

stem(x, y)

stem(x, y)

fill_between(x, y1, y2)

fill_between(x, y1, y2)

stackplot(x, y)

stackplot(x, y)

stairs(values)

stairs(values)

© Copyright 2002–2012 John Hunter, Darren Dale, Eric Firing, Michael Droettboom and the Matplotlib development team; 2012–2025 The Matplotlib development team.

Created using Sphinx 8.1.3.

Built from 3.10.1+dfsg1.

Built with the PyData Sphinx Theme 0.16.1.