Ctrl+K
You are reading documentation for the unreleased version of Matplotlib. Try searching for the released version of this page instead?
Matplotlib 3.10.1+dfsg1 documentation - Home Matplotlib 3.10.1+dfsg1 documentation - Home
  • Plot types
  • User guide
  • Tutorials
  • Examples
  • Reference
  • Contribute
  • Releases
  • Gitter
  • Discourse
  • GitHub
  • Twitter
  • Plot types
  • User guide
  • Tutorials
  • Examples
  • Reference
  • Contribute
  • Releases
  • Gitter
  • Discourse
  • GitHub
  • Twitter

Section Navigation

  • Pairwise data
  • Statistical distributions
    • hist(x)
    • boxplot(X)
    • errorbar(x, y, yerr, xerr)
    • violinplot(D)
    • eventplot(D)
    • hist2d(x, y)
    • hexbin(x, y, C)
    • pie(x)
    • ecdf(x)
  • Gridded data
  • Irregularly gridded data
  • 3D and volumetric data
  • Plot types
  • Statistical distributions

Statistical distributions#

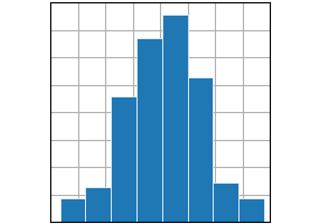
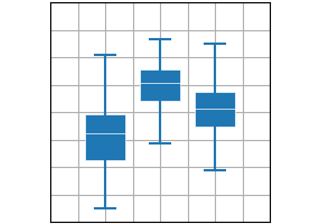
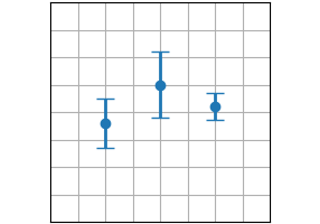
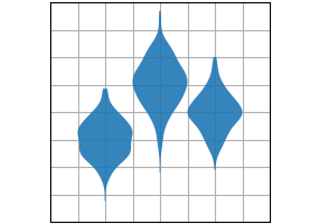
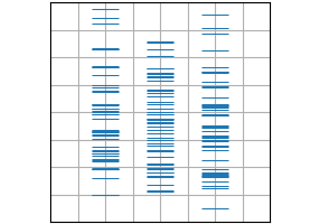
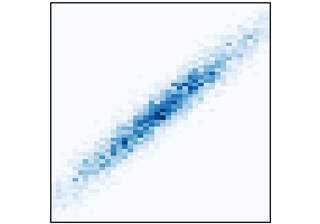
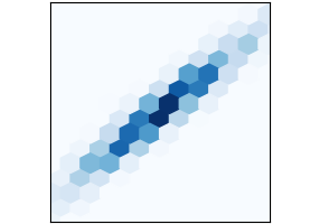
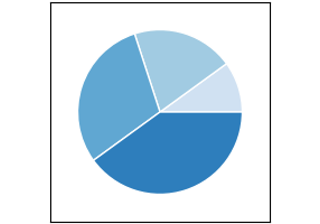
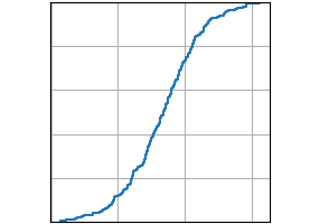
Plots of the distribution of at least one variable in a dataset. Some of these methods also compute the distributions.

hist(x)

hist(x)

boxplot(X)

boxplot(X)

errorbar(x, y, yerr, xerr)

errorbar(x, y, yerr, xerr)

violinplot(D)

violinplot(D)

eventplot(D)

eventplot(D)

hist2d(x, y)

hist2d(x, y)

hexbin(x, y, C)

hexbin(x, y, C)

pie(x)

pie(x)

ecdf(x)

ecdf(x)

© Copyright 2002–2012 John Hunter, Darren Dale, Eric Firing, Michael Droettboom and the Matplotlib development team; 2012–2025 The Matplotlib development team.

Created using Sphinx 8.1.3.

Built from 3.10.1+dfsg1.

Built with the PyData Sphinx Theme 0.16.1.