Ctrl+K
You are reading documentation for the unreleased version of Matplotlib. Try searching for the released version of this page instead?
Matplotlib 3.10.1+dfsg1 documentation - Home Matplotlib 3.10.1+dfsg1 documentation - Home
  • Plot types
  • User guide
  • Tutorials
  • Examples
  • Reference
  • Contribute
  • Releases
  • Gitter
  • Discourse
  • GitHub
  • Twitter
  • Plot types
  • User guide
  • Tutorials
  • Examples
  • Reference
  • Contribute
  • Releases
  • Gitter
  • Discourse
  • GitHub
  • Twitter

Section Navigation

  • Pairwise data
  • Statistical distributions
  • Gridded data
  • Irregularly gridded data
    • tricontour(x, y, z)
    • tricontourf(x, y, z)
    • tripcolor(x, y, z)
    • triplot(x, y)
  • 3D and volumetric data
  • Plot types
  • Irregularly gridded data

Irregularly gridded data#

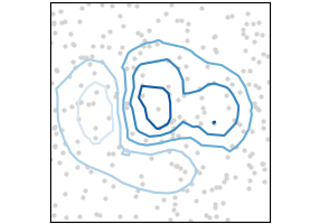
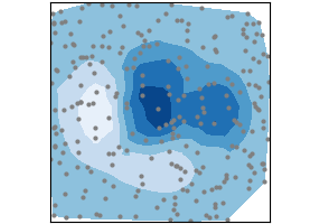
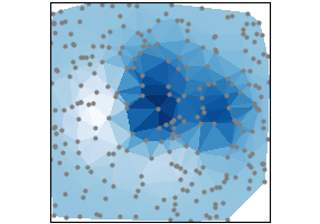
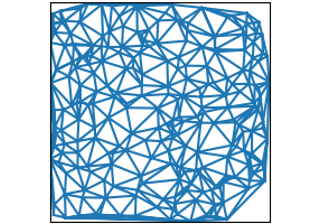
Plots of data \(Z_{x, y}\) on unstructured grids , unstructured coordinate grids \((x, y)\), and 2D functions \(f(x, y) = z\).

tricontour(x, y, z)

tricontour(x, y, z)

tricontourf(x, y, z)

tricontourf(x, y, z)

tripcolor(x, y, z)

tripcolor(x, y, z)

triplot(x, y)

triplot(x, y)

© Copyright 2002–2012 John Hunter, Darren Dale, Eric Firing, Michael Droettboom and the Matplotlib development team; 2012–2025 The Matplotlib development team.

Created using Sphinx 8.1.3.

Built from 3.10.1+dfsg1.

Built with the PyData Sphinx Theme 0.16.1.